


How I make use of Tithe Apportionment and Maps
This is both sharing with you the reader and helping me with some notes regarding the process for Tithe Apportionment articles, dataset, and ESRI Story Maps.
This hopes to provide a useful and consistent layout and content, which I suspect would be most beneficial in the collection of Tithe Apportionment articles.
Guide to Tithe Apportionment and Maps transcription and use
Guide to Tithe Apportionment and Maps transcription and use
The first part of this is to record the process of how I create information out of the historic data, followed by what I subsequently do with that information.
The end goal is to create sharable information for Family Historians and for myself. My choice of Parishes is reflective of my own Family Tree and the location of key ancestors in the period that the Surveys and Agreements were undertaken, about the 1840's
Introduction
Introduction
This element is fundamentally a guide for the transcription of the Tithe Allocation document and to the use of the associated spreadsheet.
The sections equate to the different tabs in the spreadsheet and the subsequent results in the associated webpage.
The sections also follow the process of creating the dataset.
Spreadsheet tables have a mix of direct entry, calculated fields, looked up data, and checking fields. Sometimes there is a colour bar above the titles to aid identifying the type of cells or fields in the column.
Generally the;-
- Direct entry are shown in a shade of blue, with light blue being the first pass of data entry.
- Calculating fields are headed with a yellow bar.
- Looked up data, i.e. information from other tables linked to this data, are headed with a brown bar.
- Checking fields, primarily to check data consistency, are headed with a red bar.
Creating the Dataset
Creating the Dataset
The original schedule is hand written on paper. Scans of those paper pages have been made. Fortunately, most of the handwriting is a lot easier to read that mine.
The images from those scans are available form the Hampshire Record Office and The Genealogist. The former also holds the original documents which can also be viewed by arrangement.
Analog images are very interesting but the data needs to be digitised to allow it to be readily accessed and interrogated.
Transcription from the scans is not very difficult, the handwriting is generally very legible, but is time consuming.
Key to creating the dataset is to have somewhere to put it, in an organised structured nature, which can subsequently be easily interrogated and analysed, producing reliable, meaningful, consistent, and repeatably results.
Primary Data
Creating the Dataset - Primary Data
Spreadsheet tab - Prime Data.
A form cell entry, not a table.
Most of the Primary Date will be found within or near the Agreement at the front of the Tithe Apportionment. There are also some checks back to the other parts of the spreadsheet but obviously these will not be correct until all of the other data is input and all the links refreshed.
There is a possibility that the total area stated in the Agreement is not the same as the sum of the parts elsewhere in the Agreement. The spreadsheet checks if the two match, however, if it shows a variance all that can be done is to check the input and transcription, and if they are correct, accept the historic variance.
Find the data and fill in the form accordingly.
Summary
Creating the Dataset - Summary
Spreadsheet tab - Names of L and O.
A table where each row is a record, and each cell in that row is a field, or element of that record.
Find the Summary on the Tithe Apportionment, sometimes after the Schedule. It has a list of all the names and the total quantity of land and total rentcharge for each combination of Land owner and Occupier, and occasionally with an addition of Lessor, with Lessee as Land owner.
The first pass is only to capture the names of those people found in the Summary, ignoring the quantity and rentcharge columns.
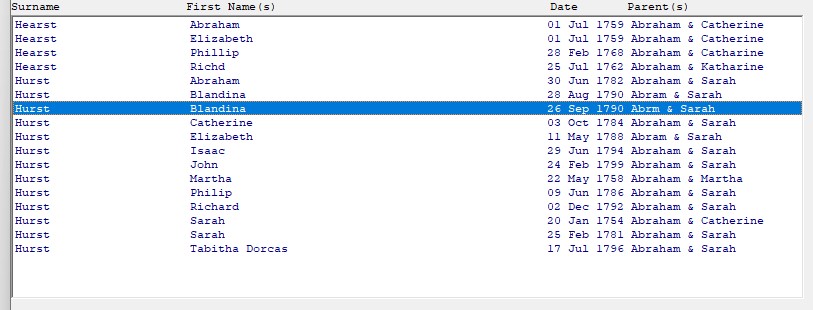
Go to the tab 'Names of L and O' which is for Names of Landowner and Occupier. From the Summary enter, in the first three columns, the persons' name, normalised if necessary to given names followed by Surname. Suffix such as Esquire or & another, or & others are inserted in the second column, named appropriately. Part of the tab's calculation area finds the surname form the name and another part strips out any remaining underscores, "_". The third column is to indicate the category, such as Land owner or Occupier, or both, using the dropdown.
Entries such as Herself and Himself are transcribed as the persons name to facilitate separate record analysis.
Also Biddlecomb Widow and the like are transcribed Widow Biddlecome for consistent interpretation. Sad to think that there was a time that a woman was so much the wife of a man, that even on official documentation, they did not have a name, just that they were the Widow of that man.
On a paper copy it is implied that a list continues with the landowner, with multiple occupiers until the next landowner is written in. We are creating a dataset as well as a transcription so each record, or row, needs all of the information, not just a blank, ditto, or ". The name therefore needs to be copied down to all appropriate rows. The same applies to the Lessor if there is one.
Other columns in the tab are not relevant at this time and include data for cross-referencing between the Tithe listed people and my TNG database and the Census data.
Spreadsheet tab - Summary.
A table where each row is a record, and each cell in that row is a field, or element of that record.
The next step is to repeat the process on the tab 'Summary' but including the total quantity of land and total rentcharge this time. Yes, this is duplication of effort, but it is done to improve accuracy by double typing, The totals are also used to check the entries of the Schedule.
In the numerical fields, blanks can be left or leading zeros, up to the first number. However intermediate blanks must be replaced with a zero. I.e. ¦ " ¦ " ¦ 2 can be ¦ ¦ ¦ 2 ¦ but ¦ 4 ¦ " ¦ 8 ¦ has to be ¦ 4 ¦ 0 ¦ 8 ¦ .
At the end of the first page there is probably a total. In a column to the right headed page, input the page or image number and drag it down to cover all the entries for that page. Going back to the values input columns, and then curser down to the bottom. Use the page number to select the relevant information, or use the filter to select the page if that does not work. If all the selections are working, the total written in the Summary and that calculated on the spreadsheet should be correct. If they are not, check and recheck the transcription.
It is easier to do checks progressively, one page at a time, instead of waiting to do the check at the end and then trying to find what page the error is on followed by doing the same check as above for the page.
If it does tally correctly, proceed to the next page and continue. The checks would not highlight compensatory errors, but further checks happen latter.
At the end of the Summary there are totals for area and monies. The spreadsheet should correlate with the historic document.
Return to the Primary Data tab and add the Area Total, Acres, R, P after the names of the Tithe Commissioners.
Repeat with the Monetary Values for both Rent Charges.
The checks inspect the input against the same information on the historical documents.
There are some tabs on the spreadsheet that use the Summary as source. PT is for Pivot Table in these instances. The tabs are 'PT Summary Area Rent', 'PT Summary V Rent', 'PT Summary IM Rent', and 'PT Summary Area'.
Schedule
Creating the Dataset - Schedule
Spreadsheet tab - Plot registry.
A table where each row is a record, and each cell in that row is a field, or element of that record.
The Schedule has all the detailed data at the all important plot level.
Landowners and Occupiers and Numbers referring to the Plan
The plot number is the first entry, that is simple enough.
The next field only applies to some Schedules, where there is a Leasor at the top of the page. Which in turn renders what would normally be Landowner to become Leasee Landowner.
(Leasee Landowner) Landowner and Occupier are the next fields, which can either be by direct typing or by using the dropdowns which are fuelled by the data filled in 'Names of L and O' tab.
Name and Description of Lands and Premises and State of Cultivation
Lands and premises field is a copy of the schedule column Name and Description of Lands and Premises. This is a typing field. Sometimes there is very useful information in this field with names that can still be found on current or older maps. Other times it is a little sparse.
The State of Cultivation on the schedule is interested in land use to establish the Tithe. For those elements it is just typing into the column of the same name. However, I am also interested in other land use. Using the Description of Lands and Premises I make and assessment of the alternative usages, generally into one or more of the following usages.
| Name and Description of Land and Premises | State of Cultivation |
|---|---|
| House and Garden | {Residence} |
| Cottage and Garden | {Residence} |
| Yard and Buildings | {Premises} |
| Farm Yard and Buildings | {Premises} |
| Blacksmiths Shop | {Retail} |
| Willow Bed and Water | {Water} |
| Roadway | {Road} |
| Waste | {Waste} |
| Chapel | {Church} |
| Common | {Common} |
| Pleasure Gardens | {Pleasure Gardens} |
| Orchard | {Orchard} |
| Plantation | {Plantation} |
| House, Blacksmith's Shop, and Garden | {{Residence}{Retail}} |
| ??? Inn and Garden | {{Residence}{Retail}} |
| House, Blacksmith's Shop, Buildings, Garden, and Yard | {{Residence}{Retail}{Premises}} |
| House and Pleasure Garden | {{Residence}{Pleasure Gardens}} |
| Mansion House, and Pleasure Gardens | {{Residence}{Pleasure Gardens}} |
| Mansion House, Buildings, and Pleasure Gardens | {{Residence}{Pleasure Gardens}{Premises}} |
The new categories of use are enclosed in braces { } to distinguish the entry apart form the transcription. Multiple uses are allocated any combination of the new categories, enclosed in a further set of braces {{ }{ }}, although avoid {{ a }{ b }} and {{ b }{ a }} as this will just collate as two entries when it is only one.
I should point out at this point that in my opinion the description 'Garden' is not how we would construe the term today. Today we might think of a front or back garden with perhaps flowers and a lawn, laid out to look good. With some of the front gardens converted as somewhere to park cars. I suspect that in 1800's 'Garden' was more akin to market garden or vegetable patch.
| Aside |
Following the end of the war in the 1940's, 50's and 60's the UK went on something of a building spree, with thousands of council houses being built. Part replacing bombed out buildings and part slum clearance. I was brought up in my early years in one such house. I recall reading somewhere that a lot of council houses built then had relatively large gardens to facilitate home production, farming on a small scale. These micro farms may have included animals, a pig, or some chickens, but mainly fruit and vegetables. A continuation of the wartime make do and carry on, self reliance. Times have changed, and as a society we moved away from grow your own, so the gardens have become more about flowers and lawns. We could be at the beginning of a move towards a return to grow your own. See Also Historic England on Post War council housing estates
|
Quantities in Statute Measure
In the numerical fields, blanks can be left or leading zeros, up to the first number. However intermediate blanks must be replaced with a zero. I.e. ¦ " ¦ " ¦ 2 can be ¦ ¦ ¦ 2 ¦ but ¦ 4 ¦ " ¦ 8 ¦ has to be ¦ 4 ¦ 0 ¦ 8 ¦ .
The area of the plot numbers are ¦ A. ¦ R. ¦ P. ¦ meaning Acre, Rood (Rod), and Perch. With 40 perch to a rood and 4 rood to the acre.
| Aside |
One Acre is the area that could be ploughed by a team of eight oxen in one day. Measuring land for ownership (and taxation) is a very ancient concept, as is the word ‘acre’, which occurs in many old languages and translates as ‘open field’. The area thus described was originally a strip of land (a long furrow, which gave rise to the word furlong, an old measurement of length) that a ploughman and his yoke of two oxen could turn over in an average day’s work – a strip being easier to plough than a square, as there were fewer turning points required. Acres. Later an acre was more accurately measured as an area which is equivalent to 10 chains by one chain. A chain is now standardised as 66 feet (20.18 m), so the actual area covered by an acre is 660 feet by 66 feet, which (to save you the maths) converts to near enough 4,048 square metres. To visualise this, a professional football (soccer) field covers an area of two acres, so one team’s half is an acre. Thus a hectare, which is approximately 2 1⁄2 acres, takes up both halves of the playing area, plus the land around it between players and spectators. Roods & perches. These are subdivisions of an acre. There are four roods in an acre, and in turn a rood contains 40 perches. As a rood is a quarter of an acre, it contains 1.012 square metres – about the size of two tennis courts. Each of the 40 perches in a rood thus consists of just over 25 square metres – the size of one of the net-side playing areas of the tennis court. One chain is also the distance between wickets on a cricket pitch. The chain (abbreviated ch) is a unit of length equal to 66 feet (22 yards), used in both the US customary and Imperial unit systems. It is subdivided into 100 links. There are 10 chains in a furlong, and 80 chains in one statute mile. In metric terms, it is 20.1168 m long.
|
Each plot has an area measurement and therefore an entry under Quantities in Statute Measure. However, not every plot has an entry under rent-charge.
Amount of Rent-Charge apportioned upon the several Lands, and Payable to the Vicar / Rector / Impropriator
There are now two groups of columns, one group regarding the rent-charge payable to the vicar, and the other to the Impropriator.
Each group separated into ¦ £. ¦ s. ¦ d. ¦. £ s d being Pounds, shillings, and pence. With 12 pence to the shilling and 20 shillings to the pound. If you are of a certain age you will be able to add up the values easily.
Sometimes the Tithe Apportionment pro-forma only has one group of rent-charge, as is the case with Nursling, with the charge payable to the Rector. I don't think it makes much difference but I have decided to record the entries for the Rector under the columns for Impropriator. I will hide the columns for the vicar for the time being to aid filling in the data.
Applies to both Quantities in Statute Measure and Rent-Charge
Where there is one Landowner and one occupier for a single plot there is a single entry for each such set.
Where a Landowner has a number of occupiers across numerous plots, there might be a subtitle for that landowner. In such a case add a sub-subtitle into the column headed Sub title info. The numbers entered adjacent to such annotations are treated differently in the totals calculations to avoid double counting. Adding the sub totals in this way should allow the entered data to look similar to the original document. Which should allow better visual checking of data entry.
At the end of the each page there may be a total. This would be annotated sub-total.
If there is a total at the end of the page set the filters to that page and filter out the sub-subtotals and the subtotal annotations in the column headed Sub title info,and the totals displayed should equal those shown on the original document. If not firstly check for the correct page designations, and filter settings. Then check the entries. Then check the entries again. If after all these checks there is still a variance, check the arithmetic on the original document.
Whatever the outcome of the checks, transcribe the document as it is, and make a note in the notes column of the variance and suspected cause. So if the Tithe Apportionment has the rent-charge sub-total of £ 3 5s 10p but it should have totaled £ 3 6s 10p write the original £ 3 5s 10p and note the 1s variance. Expect that variance to show up again in the totals.
Obviously, if the error is found to be an incorrect transcription/data entry then that is corrected. A 3 looks like and 8, but the totals confirm that it was a 3, go back and change it from a 8 to a 3.
The same applies to the sub-subtotals as you work your way down the page. You can either use the filtering method or hone your arithmetic skills other than decimal, with 40, 4, and 12, and 20, being the shift to the next column.
If you do use the filtering method, there is a yellow box under the data input area of the table which does the arithmetic for you. But don't forget to either filter out the sub-subtotals or do it before entering the data, otherwise you will get incorrect totals. A reminder, this procedure is to check your data entry, not the Tithe Apportionment arithmetic.
In some instances the occupier or landowner may be split across more than one page with the use of 'carry forward' and 'brought forward'. I have not created a mechanism for dealing with this as it is not required in a continuous record set. It is very much a paper based way of doing things. A very good way, I might add, for paper. So although the record set should look similar to the original, this is left out, both the 'carry forward' at the bottom of the page, and 'brought forward' at the top of the following page. However, I do consider it prudent to think of it as a sub-total and check if my input thus far equals the stated 'carry forward' figure by using the filters as above. As long as that is the case, I just move on and discard them. If not, I find the cause of the variance.
Additional information
Creating the Dataset - Additional information
Spreadsheet tab - Plot registry.
Still working on the Plot Registry and data from the The Schedule.
Name and Description of Lands and Premises and State of Cultivation
| Number of dwellings | Sub total info |
Where the information from the original document implies a residence, such as House and Garden or Cottage and Garden add a 1 to the column headed 'Number of dwellings'. If is states Two Cottages, add a 2, etc.
Ultimately, that will provide the total number of dwellings covered by the Tithe Apportionment survey, which can be compared to the appropriate Census.
Sub total info has been dealt with above.
| Include in Landowners report | Include in Occupiers report | Owner Occupier | Probable Residence |
Include in Landowners report / Include in Occupiers report
Are both part of data checking.
Owner Occupier
Owner Occupier is actually a calculated field not a direct entry. It reports true if the entered Landowners and Occupiers Names are the same.
Probable Residence
Probable Residence is a simple drop down 'True' statement where the description suggests that there is one or more dwellings on the plot. It could have been a calculated field based on the 'Number of dwellings' column but this gives a degree of data checking.
Place named
I have recently added a column headed 'Place named', which is intended as a 'TRUE' or blank. With reference to the Description on the Schedule the are several named fields which could be useful, but they don't qualify for a 'TRUE' in this column. A named inn, a church, or named mansion are all examples which would be 'TRUE'. The idea being that when the data is filtered to 'TRUE' the named places can be searched for on old maps. Once a particular named place is located on both the Tithe Map and an old map it is easier to start matching plots on the Tithe Map to fields and places on an old map, which can then be used to create the associated latitude and longitude.
Page and notes are further into the 'Engine' as shown below.
The page is just the page number of the Tithe Apportionment for this particular Parish. The Page number can also be used to create page totals and to check the data entry of the figures where the Tithe Apportionment has page totals. A change of page number generates a broken underline at the first six fields of data entry.
Notes are just that, either notes on the Tithe Apportionment document or your own notes. I do not normally add the coded / accounting annotations found at the edge of some rows on the Tithe Apportionment.
I use the notes to record variations in arithmetic (errors on the original Tithe Apportionment) - rare, but do occasionally show up.
Checks
As well as the double entry typing as part of the checks there are both overall and detailed checks.
The basic overall checks are included in the Primary Data tab. Rudimentary TRUE or FALSE statements which combine to either a sad or happy face.
Following completion of Names of L and O, Summary, and Plot registry, we need to check for consistency of names and the presentation of those names. In a dataset John Smith is different to Smith, John, so all the answers about that person will be incorrect. John Smith and John Smith and others is similarly a problem if they are meant to be the same but OK if they a meant to be different.
Go to PT LO Check or PT OW Check, yellow tabs. Refresh the Pivot tables.
There are two collection Pivot tables, one from the detail, Plot registry, and another from the Summary. The two adjacent columns, Compare and Correct, checks for a match of the area quantities for each person in the detail against the summary. However, if the names mis-match by as much as a trailing space, the calculation returns N/A. Filter all of the N/A and find the variances in the names. Then amend the name in the Names of L and O and Summary, to match the detail, where it is appropriate to do so. It is natural to create a summery from the detail, which is why I have given preference to the detail being correct. The variance could have been created by me or on the original documents. Either way, a correction is needed for subsequent calculations. I do not tend to make notes about these changes. If however, the problem is caused by two people having exactly the same name, then add something to differentiate them, such as a 2 at the end of one of the names.
Once all for the names inconsistencies have been resolved in both PT LO Check and PT OW Check it is time to look at the values. Variances are shown highlighted FALSE. Check and resolve the differences, often by checking the original scans, and the consistent use of suffixes such as '& Others' or '& another'. Sometimes there will be an annoying small variance that just does not want to be found. It can be something as simple as 1 3 "" instead of 1 3 0.
In the unlikely even that there is a demonstrable error in the original documents, there is a facility to record that in the Primary Data tab, in the compare section. Then you can still get an OK for the spreadsheet data whilst still keeping its integrity.
Spreadsheet Engine
Creating the Dataset - Spreadsheet Engine
Spreadsheet tab - Plot registry.
Still working on the Plot Registry and data from the The Schedule.
This section is all about the backroom stuff. The calculations that help verify the input data and aid analysis and data interrogation.
The stuff that goes on in the background without direct input.
Generally with yellow or brown column headers.
| Landowners Initial | Landowners Family Name | Landowners Given Names | Occupiers Family Name | Occupiers Given Names | Page | Quantities in Statute Measure | Rent charge payable to Vicar | Rent charge payable to Impropriator | Landowners names included in TNG | Landowners names included in TNG ref | Occupiers names included in TNG | Occupiers names included in TNG ref | Notes |
| Parish | Latitude | Longitude | Landowners Area | Landowners V Rent | Landowners IM Rent | From Summary Landowners Area | From Summary Landowners V Rent | From Summary Landowners IM Rent | Check | Is Plot ID a number |
In hindsight, Page and Notes would be at the end of the other direct entries, not mixed within the calculated and lookup fields. Parish is looked up from the Prime Data, and the Latitude and Longitude is looked up from another data entry table specifically for location.
Output
Creating the Dataset - Output
Your text...
Geolocation
Geolocation
Matching the Tithe Map to current Mapping
As stated above, It is unnecessary to discuss in detail the problems of interpreting a tithe map; but it is well to bear in mind that reliance cannot be placed upon the area of individual tithe areas stated in an apportionment or computed from the tithe map, unless the map is scaled.
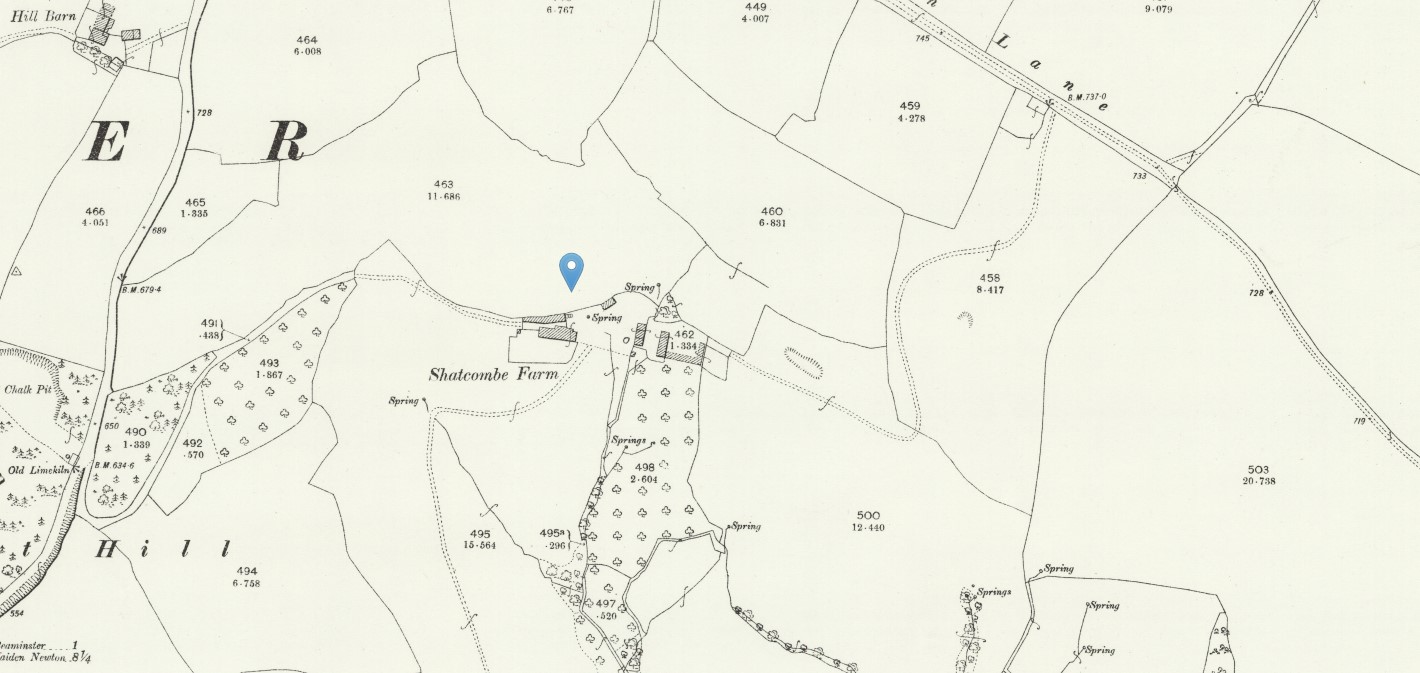
I therefore resort to comparing the Tithe Maps to the Ordnance Survey 25" maps held by The National Library of Scotland and prefer the Georeferenced Mapping.
It is not that easy to see the correlation with the OS Map with it's Northerly orientation compared to a Tithe Map which is normally arranged to best fit the paper.
Sometimes I can rotate a digital copy of the Tithe Map 90o or more, to approximate the Compass Rose northerly direction. It is then more discernible as to whether it is the same location as indicated on the 25" OS Maps as being the same as the Tithe Map.
Unfortunately Tithe Maps are frequently without place name annotations. So it is generally down to shapes to enable identification of the places by comparison to both old and current maps.
The shapes of the rivers, roads, and fields as well as the plot numbers confirm that it is the same hand drawn map. Fields are amazingly often the same shape now and then.
Another point of help can sometimes be the Apportionment Schedule, if the plots have named places which can be identified and found on the comparison map.
The first Tithe Map I used was from the Hampshire Record Office. Latterly I use the Tithe Apportionment and Maps held at The Genealogist, under the Landowner & Occupier Record Collection. Some of their Tithe Maps are now geolocated, which makes matching a lot easier.
Spreadsheet tab - Lookups A
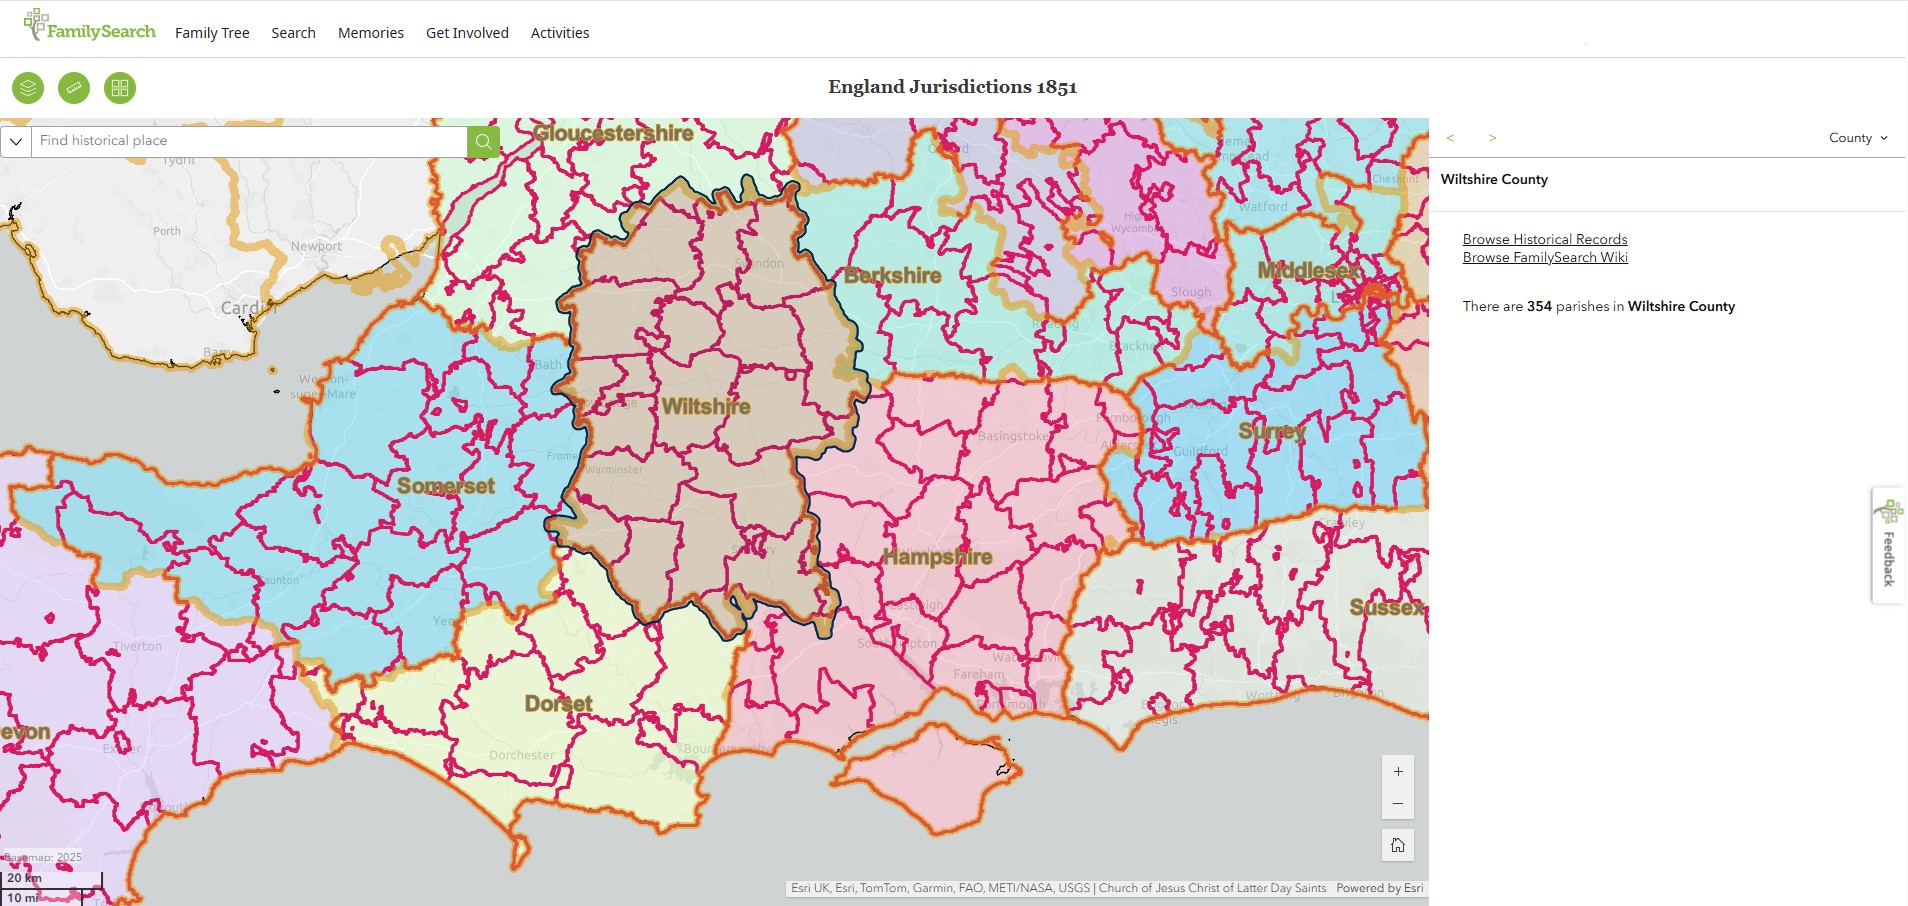
Working on the tab Lookups A and from the Tithe Apportionment Maps, OS Maps held at the The National Library of Scotland, and the Esri COE Pariah Map. Referring to the Parish itself, what are the significant settlements of the time. The Esri COE Parish Map give the current extent of the parish, which is probably not the same as the time of the Tithe Apportionment, but will assist in interpreting the other, older maps.
Click on the map both for details about the parish and to show the current boundary.
Compare settlements to the relevant old OS map.
Another source of information is British History Online. The link is a description of the Parish of Nursling, Hampshire.
I currently have a subscription to The Genealogist which with their recent enhancement, of geolocated maps, allows me to check which settlements I have identified are actually within the Tithe Map.
Then it is just a case of entering those settlements into the table headed 'Valid_Settlement' on the tab 'Lookups A', and selecting from the dropdown if they are a hamlet, or village, etc.
Refresh All on the spreadsheet and that information is now available in the 'Location' tab of the spreadsheet.
Spreadsheet tab - PT Plot number.
Working on the tab 'PT Plot number' and data from the The Schedule.
The first elements are two simple Pivot Tables. The first gives the total number of Plots recorded in the dataset in the 'Plot Registry', and the second checks for duplicate plot number entries. If found to have more that one entry for a particular plot number, check if it is a transcription error, and correct accordingly. If it is an error on the original Tithe Apportionment or Map, add a non-numeric suffix to one of the numbers, perhaps a special character such as a # or a *. All plot numbers it the spreadsheet engine must be unique for the cross referencing to work. Make a note of the change and why in the associated note column.
It next part is jiggery-pokery. It is all about the complexities of sorting a list of both numbers and numbers with an alpha suffix. One way is to use the pivot table sorted list. This however, has the numbers first followed by the numbers with the suffix. These are all text entries, so 7a comes after 429b. It is manageable, but not elegant.
The column headed 'Plot number numeric sort' is the resultant info following a little jiggery-pokery, where the 7a comes after the 6, so is more intuitive to use.
Once all the plots have been added to the 'Plot Registry', move to the 'PT Plot number' and check that the formulas extend to all the rows necessary to capture the whole of the 'Plot Registry' dataset, including the ranges on the formula, in the 'Plot number numeric sort'.
Do some cross checks to see if the results are as expected.
There will be a string of zeros at the start of the column as the sub-subtotal, and subtotal lines do not have a plot number but are still part of the dataset.
Move to the end of the zeros, and copy the contents of the column, from the first non-zero cell, to the last non-zero cell, and paste as values only into the column headed 'Plot' in the table on the tab 'Location'
That should instantly fill in the relevant data from the 'Plot Registry' tab.
Check that the data is as expected for a few sample plot numbers, both numeric and alpha-numeric.
If all is well, move to the next step, which is populating the 'Location' tab, as described below.
Spreadsheet tab - Location
Working on the 'Location' tab and data from the The Schedule and the Tithe Map
The first column is populated as above described in Spreadsheet tab - PT Plot number.
The next eight columns fill in before your eyes based on the plot number entered in the 'Plot' column.
Do not be tempted to mix up the data entry tasks by starting this table before completing the transcription of the The Schedule into the 'Plot Registry'. The plot list is not designed to be dynamic, on purpose. If new plots are added, the list will have to be generated again. This will result in some, if not all, of the Latitude and Longitude data becoming disassociated from the plot number and the eight other pieces of information. This will result in either starting the 'Location' work again from scratch, or a lot of copy and paste work to try and remedy the error of judgement.
How to find and add the Latitude and Longitude.
Starting with the plots that have named places, find the same places on the OS 25" map. Then look at all the surrounding information. Are there enough similarities to fairly robustly identify the place as being one and the same.
For instance, on the Nursling Title Apportionment, in the Description column of the Schedule, there is and entry of 'Horns Inn & Garden' against plot 278. There is a Horns Inn marked on the old OS 25" Map and there are similarities in plot shape and size, together with similarities with road layout and adjacent fields and premises. All in all, enough to make a preliminary assessment that they are one in the same place. The Latitude and Longitude of the cursors position are shown in the bottom right hand corner of the map image. One way would be to write that number on a scrap of paper and manually type it in. However, I prefer to add a marker pin to the relevant point on the map. Then look to the website address, and the last few characters, after 'marker=' are the Latitude and Longitude of the marker and therefore the plot. Copy that data and place it into the appropriate line in the column headed Lat Long. The spreadsheet is set up for that format and extracts the relevant Latitude and Longitude.
Before moving on to the next, copy the full website address, of the map and marker, paste it into the 'Map Link' column. Excel normally automatically turns this into a hyperlink. This allows you and others to look at the source of your data, so it can be reviewed, checked, and validated. The repetition of work does not take long and is well worth it, especially from a data integrity point of view.
Repeat for the other identified named places, and then consider the comparison for the whole of the tithe map to the OS map and ascertain if there is a reasonable correlation, including reference to the Compose Rose.
If so, work along roads and rivers, to establish plot Lat Long and then start the infill areas. It is surprising how may fields still have either the same basic shape, or there are discernible similarities between joined fields or woodlands, and their constituent parts.
I tend to go for the approximate centre of mass, as it were, for the placing of the mark, but for the purposes of this exercise it does not have to be exact. As long as it is in the right field, it is good enough. Some plots are so small that there is little option for maneuver.
Eventually, after a significant amount of time you will find that all of the plots have been geolocated.
A quick note regarding the use of Inns as a place name. Sometimes they change name, and it will take some time and research to trace back to the time of the Tithe Apportionment to establish the names then and now. It may therefore be expeditious to discount it as and initial plot to be correlated, and just work it the same as the other plots in the area.
Google Earth
Google Earth
ESRI Story Maps
ESRI Story Maps
Your text...
Creating the Website
Creating the Website
My website articles with regard to Tithe Apportionment has been amended due to Mr Gerry Dutton of Basingstoke whose work on the The North Hampshire Tithe Map Project and the resultant website gave me the inspiration to consider my work on Tithe Apportionment and Maps as a collective as well as the previous thought of only including the work within the relevant One Place Studies or articles.
At the time of writing I am building my fourth Tithe Apportionment dataset and the associated articles within my Genealogy website. Unsurprisingly it has evolved and improved on each draft. For the forth iteration I am creating a template to structure both the information and the resultant articles, based on past experience and The North Hampshire Tithe Map Project.
I will use the new template, which is not a copy of The North Hampshire Tithe Map Project website, but a re-imagining of mine, to rework my previous articles on the subject. They will be separated form the original articles and used as both standalone article together with articles in articles for the original work and the collective Tithe work.
The format will be;
Introduction
The first paragraph will be;
Introduction
For details about what Tithes where, how they came about, and the Tithe Computation Act that gave us all this wonderful information read the article titled Tithe Commutation Act 1836.
This link points to this article but avoids repeating the same text every time there is a Parish Specific Tithe Apportionment Article.
Having said that, including it as an article within article, does make the overarching article a standalone document. It can be skipped if already read in another article.
Notes
Notes and Stories
Your text...
Transcription
I transcribe the text of the Tithe Agreement directly into the article for the Tithe Apportionment for the Parish. I use additional script fonts the help maintain the emphasis of the original document, but without attempting to make it a facsimile of that document.
Once I have completed and checked the transcription, I make a copy of it lower down the article, convert it all the Arial 12, select the plain text transcription, and print the selection to pdf. I then upload the file and place a pdf link just beneath the first transcription section, and delete the plain text transcription from which it was formed. Nobody wants to read the same dry text twice. This gives the ability for those that want or need to, read the plain text version as a pdf in a new window.
Primary Data
The Primary Data element of the website is by en-large from the tab of the same name. The spreadsheet page is embedded into the website, with the grid showing. It is interactive, so a change in the spreadsheet is reflected in the website upon refresh.
Detailed Data - Summary
The Detailed Data - Summary element of the website is from the tab called 'Names of L and O'. The spreadsheet page is embedded into the website, with the grid showing. It is interactive, so a change in the spreadsheet is reflected in the website upon refresh. Your text...
Detailed Data - Summary Landowners and Occupiers
The Detailed Data - Summary element of the website is from the tab called 'Names of L and O'. The spreadsheet page is embedded into the website, with the grid showing. It is interactive, so a change in the spreadsheet is reflected in the website upon refresh. Your text...
spare 3
Your text...
spare 4
Your text...
spare 5
Your text...
Conclusion
Conclusion
Your text...